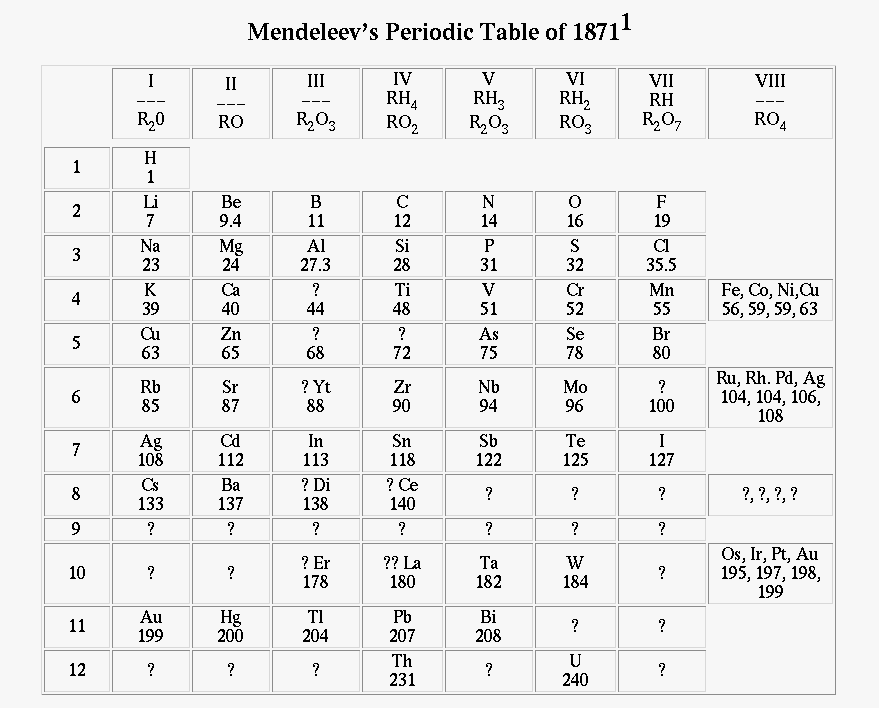
In 1870, Dmitri Mendeleev was the first person to decide to put all the elements on a "table" so that it could be more organized and easier to study. Since then, it has the periodic table has been made better along with additional elements.
To find out what the periodic trends are, we have to graph it and study them carefully.
Density: After graphing, you should be able to find that density usually increases along with the atomic number.
Melting and Boiling Point: After graphing, you should be able to find out that the melting and boiling points for metals usually increase from bottom to top of a group, and that for non-metals, they have an increase for melting and boiling points.
Ionization Energy: After graphing, you should be able to find out that it increases in a period (left to right), and it decreases as a group (top to bottom).Electronegativity: After graphing, you should be able to find that it increases from left to right.
Atomic Radius: After graphing, you should be able to find that it decreases as a period and increases as a group.

No comments:
Post a Comment