Some important formulas to remember:
Density = mass/volume
Volume = length x width x height (which also happens to be thickness)
Don't forget that 1cm^3 = 1mL
You can also refer to the previous post for the Percent Experiment Error formula.
NOW ON TO GRAPHING!!!
One of the fundamentals in sciences and physics is learning how to express your data. Today, we were able to create graphs using Microsoft Excel.
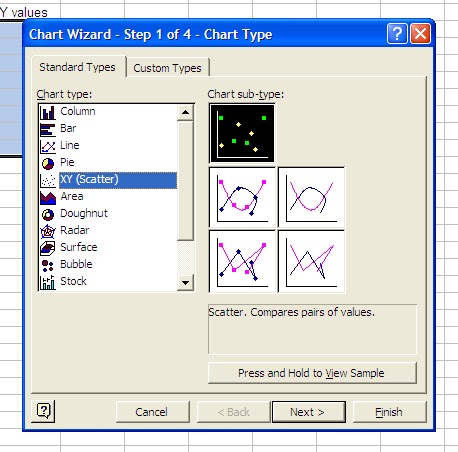
Here are some instructions accompanied by screen shots that I took:
1) Enter your x values.
2) Under the next column, start by entering an equation that relates x and y. In my case I stated that y=A3(representing the x values) + 2.

3) Enter. The y value in accordance to the formula should appear.

4) Next, click on the first y value box. Hover your cursor over the bottom right hand corner. A small plus sign should appear.
5) Drag the plus sign down so that the rest of the y value column is covered.


8) Customize the graph as you would like it. Keep clicking next, fill in the title, and click finish.

9) To add a linear trendline, right click on one of the points and click "Add Trendline." Go to options and click on the box that says "Display equation on chart" if you wish to display the equation.


10) To customize the chart, you can right click anywhere and choose "Format Chart Area."
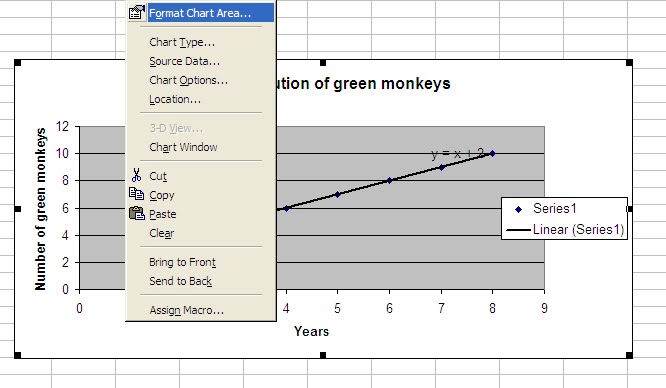
11) Do a little editing and TADA! You can make your graph beautiful :)

Another great tool that can be used to create graphs or do another neat things is GEOMETER'S SKETCHPAD.
Watch to learn how to use it!
No comments:
Post a Comment